On the Dashboard page, VTEX store owners have access to metrics from the VTEX Conversational Commerce channel. In this dashboard, you can view the sales performance and session indicators, filter them by period and export them to a CSV file.
Data
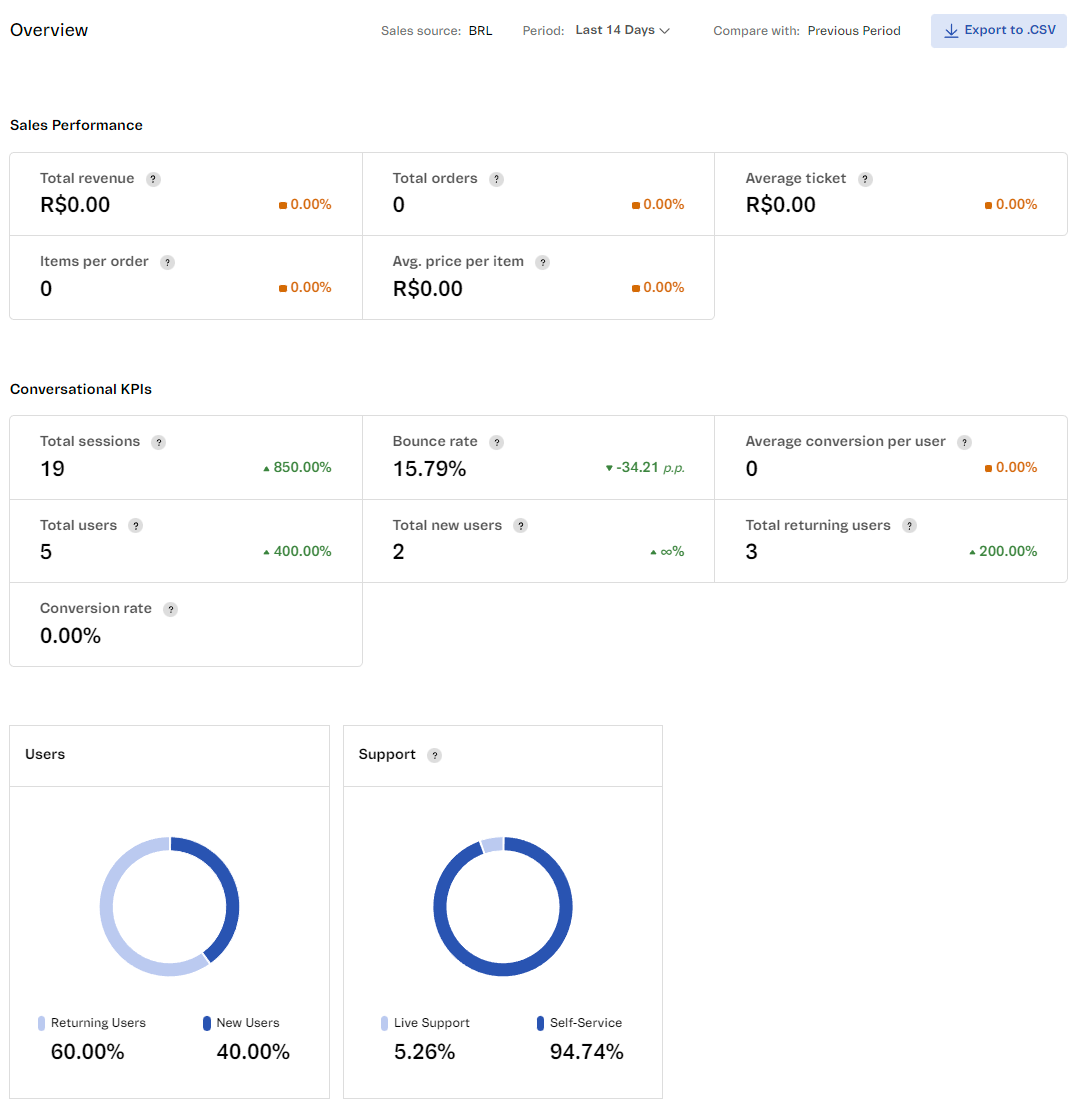
The data displayed in the dashboard is divided in two sections: Sales Performance and Conversational KPIs. They can be filtered by period and compared to the previous one.
Sales Performance
In this section, the numerical data related to the sales made through Conversational Commerce are displayed, which are:
- Total revenue: Sum of final totals of all captured orders during the selected period.
- Total orders: Total captured orders during the selected period.
- Average ticket: Average amount paid for captured orders during the selected period.
- Items per order: Average number of items in captured orders during the selected period.
- Avg. price per item: Average amount paid for items in captured orders during the selected period.
Conversational KPIs
In this section, data related to the VTEX Conversational Commerce channel and its usage is displayed. It is provided in both numerical and chart formats.
The data in numerical format are:
- Total sessions: Total number of sessions in the selected time period. A session is a period in which a user actively interacts with the WhatsApp channel.
- Bounce rate: Percentage of sessions in which a user only sent one message via WhatsApp and didn't interact through this channel again.
- Average conversion per user: Average number of orders per user via WhatsApp in the selected period.
- Total users: Total of unique users who had at least one session via WhatsApp in the selected time period.
- Total new users: Number of unique users that had their first session via WhatsApp in the selected time period.
- Total returning users: Number of unique users who have previously interacted via WhatsApp and had at least one session in the selected time period.
- Conversion rate: Percentage of orders divided by the total number of sessions in the selected period.
The data presented in charts are:
- Users: Chart showing the proportion of new and recurrent users in the selected period.
- Support: Chart showing the proportion of supported versus self-service sessions. Self-service refers to the percentage of sessions without assistance from a human agent in the selected period. Live support represents the number of sessions that had assistance from a human agent in the selected period.
Filter by period
The page data is refreshed every hour, so users can expect a 10-80 minute delay depending on the time they accessed the page. It also allows users to filter data based on the selected time period and compare store metrics with previous dates.
To view data from different periods, select the desired one from the Period dropdown menu at the top of the page. Date filters include the following options:
| Period | Start | End |
|---|---|---|
| Today | 00:00h of the current day | The last time the data was updated when the user accessed the dashboard |
| Yesterday | 00:00h of the previous day | 23:59h of the previous day |
| Last 7 days | 00:00h of the eight days before today | 23:59h of the day before today |
| Last 14 days | 00:00h of the 15th day before today | 23:59h of the day before today |
| Last 30 days | 00:00h of the 31st day before today | 23:59h of the day before today |
| Current month until today | 00:00h of the first day of the current month | 23:59h of the day before today |
The data always carries the comparison of the period before the selected one through the comparison percentage on the right-hand side to support your analysis. So if you select the Last 7 days period, the dotted line in the chart indicates data from the last 7 and 14 days ago, for example.
Exporting data
You can export the dashboard data to a CSV file. To do so, click the ↓ Export to .CSV button, and the file will be downloaded to your computer. The exported data will consist of the selected period in the dashboard and be sorted by date. The fields in the CSV file are:
- Date
- Total sessions
- Average conversion per user
- Bounce rate
- Total users
- Total new users
- Total recurring users
- Conversion rate
- Percentage of recurring users
- Percentage of new users
- Percentage of human support
- Percentage of self-service