The updated version of the Store Overview (beta) page is available for use free of charge on the VTEX Admin during the beta phase or until stipulated by VTEX. It is important to note that charges may apply in the future. For the time being, the current version of the Store Overview page on the VTEX Admin will continue to be available.
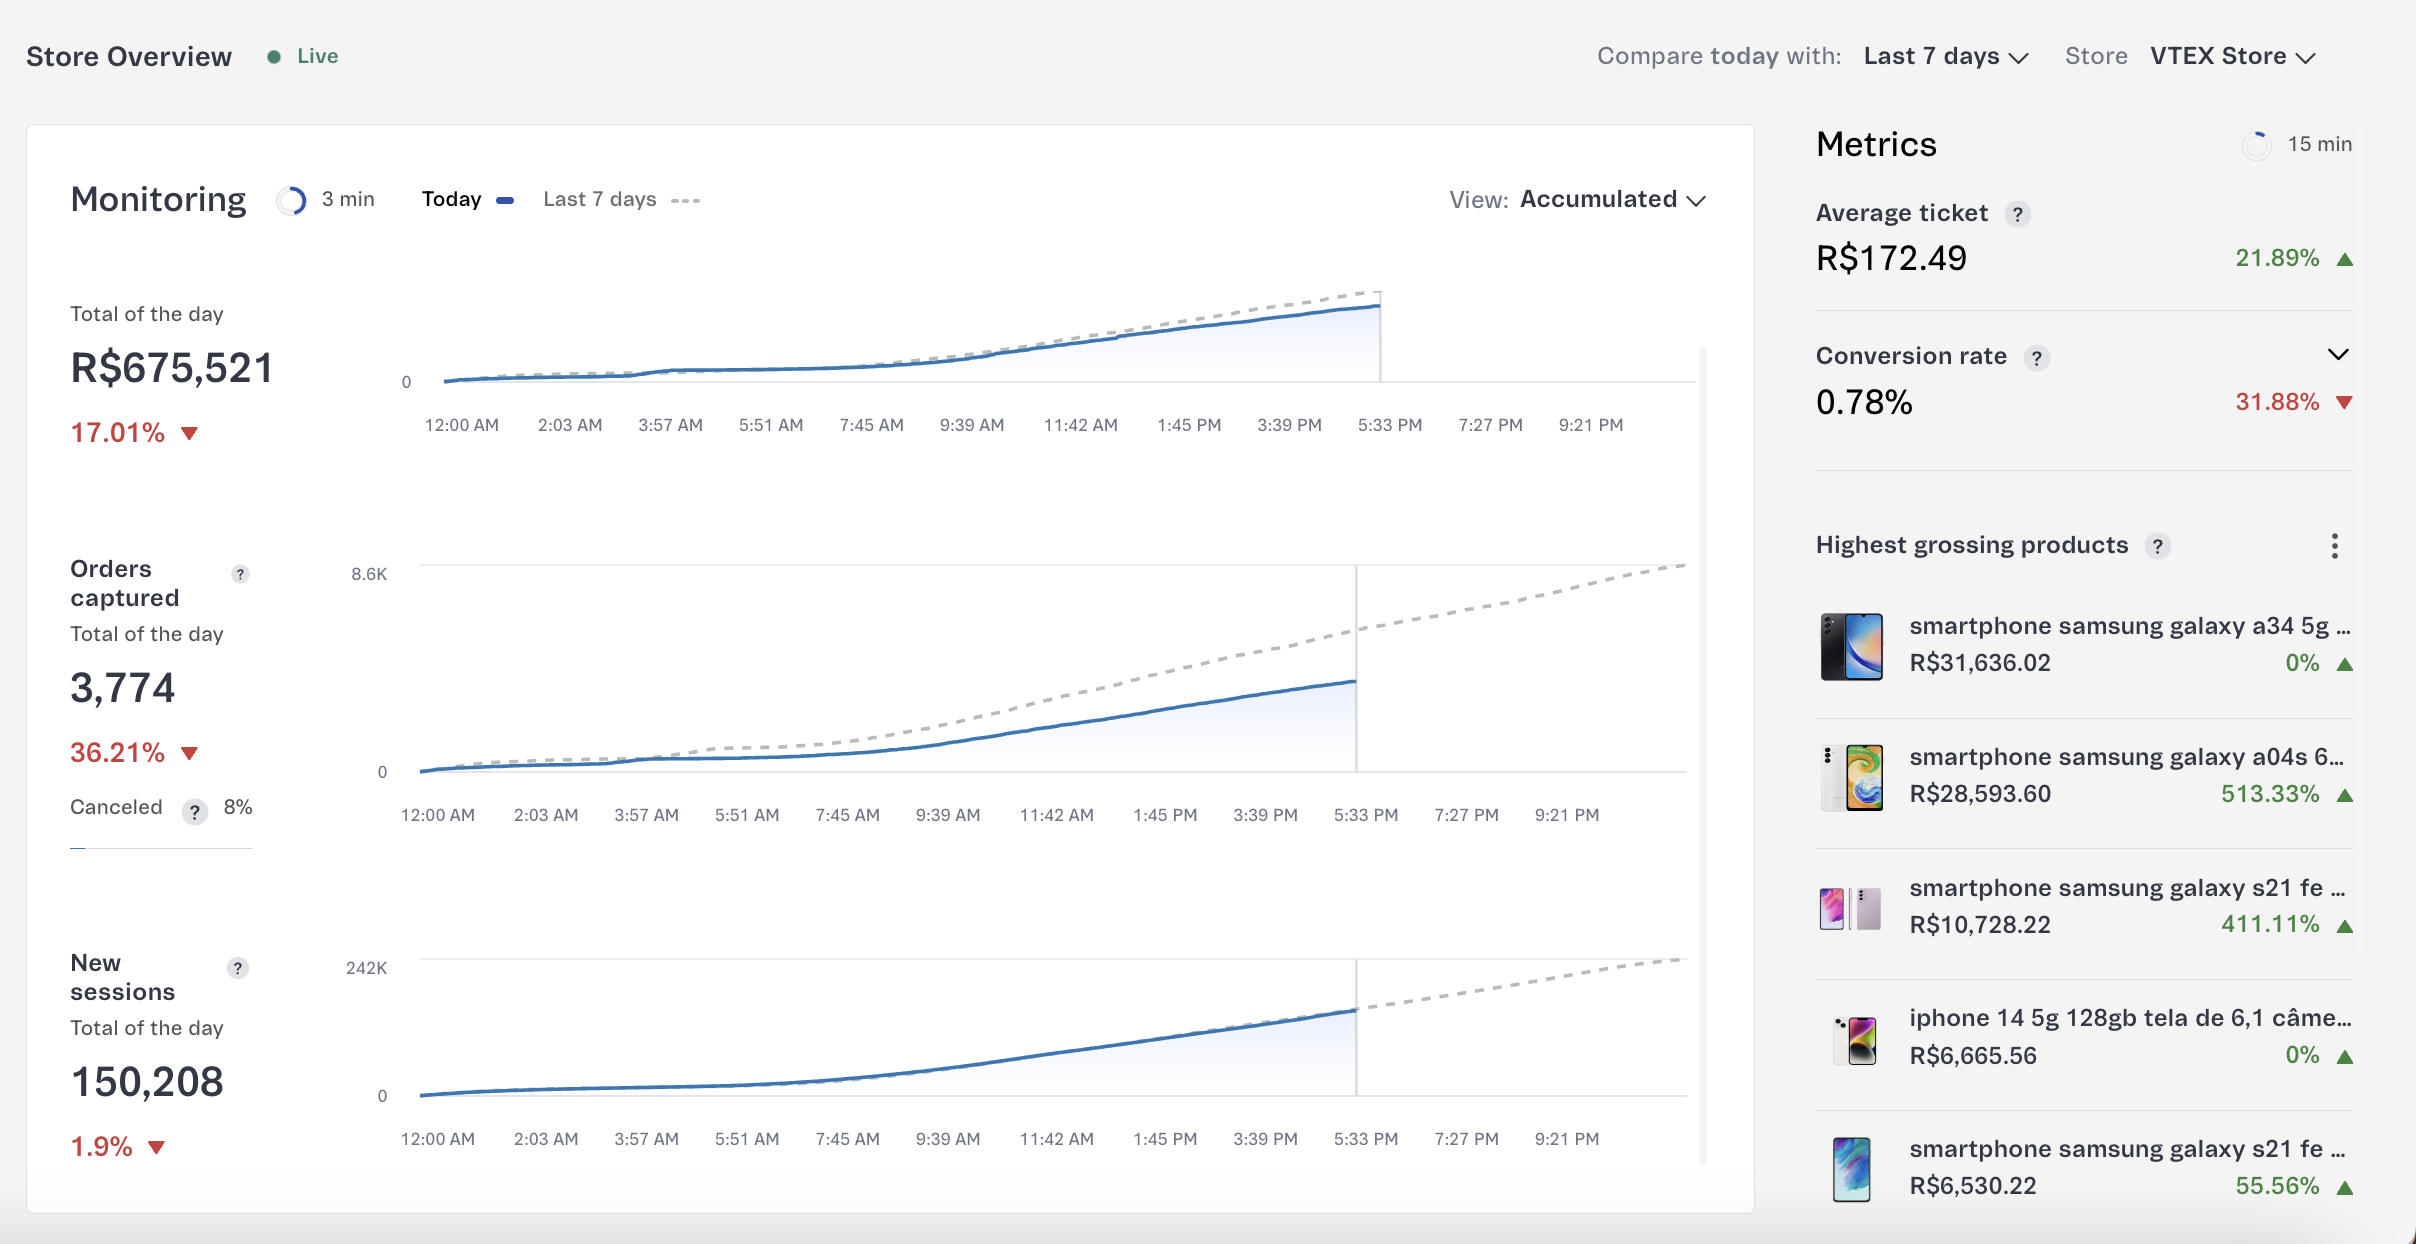
The Store Overview (Beta) page in your VTEX Admin provides real-time tracking of your operation on the current day, giving visibility into indicators that allow you and your team to get feedback about actions applied to the store and to quickly implement improvements.
This tool is available on the homepage of the VTEX Admin. To view it, click Dashboards > Overview in the navigation menu, or type Overview in the search bar at the top of the page.
In this article, we describe the main page sections and actions. You will learn more about:
Page data
The metrics on this page include order and browsing data collected by different systems.
The revenue metric may differ from the average ticket metric recorded in the OMS and Sales Performance, for example. This is because Sales Performance considers an order's item values, while OMS also considers discounts, freight, fees, and promotions applied to the order, which may increase or decrease its final total.
- Orders and revenue: The order and revenue data comes from the VTEX Order Management System (OMS) and includes orders placed on all your sales channels.
- Sessions: The browsing data comes from the platform’s internal system, which collects user sessions from storefronts of VTEX stores. Sessions represent the total number of views on pages accessed by a single user while browsing through your ecommerce store, excluding marketplaces, apps, VTEX Sales App, or other sales channels.
Data restrictions
We do not collect browsing data from non-VTEX storefronts or from sellers who only offer products on external marketplaces. This means that the charts displayed in the Monitoring section may not be available, depending on whether we collected browsing data from your store.
Although we aim to show a maximum of 3% divergence from the VTEX OMS data, sometimes you may find discrepancies between the data reported on the Store Overview dashboard and the OMS data.
Data update
Different page data have different update frequencies. The charts in the Monitoring section may be updated as often as every three minutes, depending on the View, while other sections are updated every 15 minutes. The "1 min" label shows the last time that the page data was updated.
Analyzing results and operation health
You can use different metrics and monitoring charts for analyzing results, depending on what you want to explore. The table below can help guide your analysis. Click each metric listed in the table to learn more about how it is calculated and how it works.
| Objective | Related metrics and charts |
|---|---|
| Action engagement | - New sessions - Best-selling products |
| Financial results | - Revenue captured - Average ticket - Highest grossing products |
| Conversion | - Conversion rate - Sales funnel - Orders captured, compared to the number of canceled orders. Depending on the outcome, this can guide your team to identify operational problems in fulfillment or customer service that resulted in canceled orders. |
Keep in mind that while the Monitoring charts are updated within three minutes, Metrics charts take fifteen minutes to be updated, which can influence the analysis of results. Learn more in Data update.
Analyzing campaign results
If you want to analyze the results generated by campaigns, promotions, or new product launches that occurred in the past, follow the instructions below:
- Select the Store where the action occurred.
- Select the campaign Date to compare that period with today's date.
- Select the
Accumulatedview. - Track the hourly performance of metrics.
Tracking the impact of changes in the store
To maintain a healthy and stable operation, it's important to identify if any deploys, campaigns, or setting changes have a negative impact on the number of orders, sessions, or customer conversion immediately after they are applied.
If you want to see the impact of store changes, either to identify negative effects or changes in the health of your business, follow the instructions below.
- Select the Store where the action occurred.
- Select the
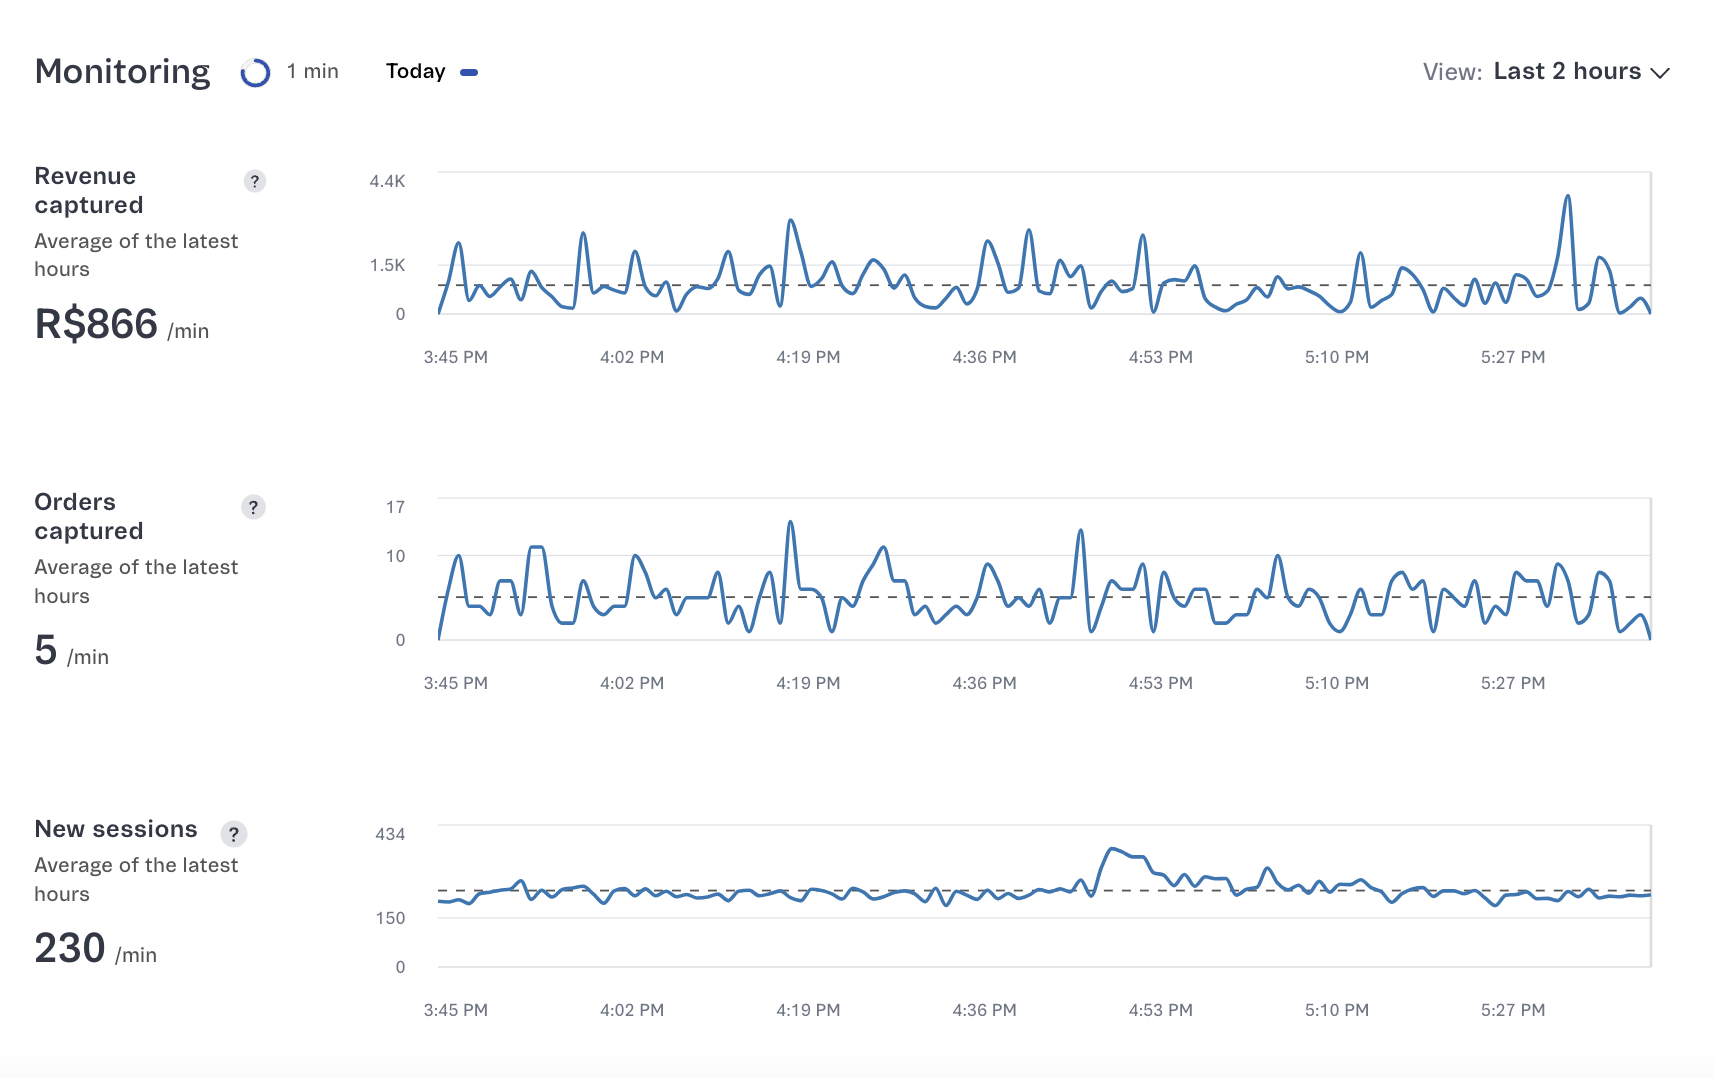
Last 2 hoursview. - Check the pulse of the metrics or inflection points in the chart in the last two hours.
- Compare the times of the inflection points with the applied changes to identify their cause and impact.
Comparing periods
You can filter data based on the selected period and compare store metrics with past dates. To compare data from different periods, at the top of the page, select the date next to Compare today with: and, then, select one of the following actions:
| Period | Start | End |
|---|---|---|
| Yesterday | 00:00 of the previous day | 23:59 of the previous day |
| 7 days ago | 00:00 of the eighth day before the current day | 23:59 of the day before today |
| 28 days ago | 00:00 of the 29th day before the current day | 23:59 of the day before today |
| Custom | Select in the calendar the desired Comparison date up to 13 months in the past | 23:59 of the day before today |
Views
When you click the View: button in the Monitoring section, you can toggle between the following options:
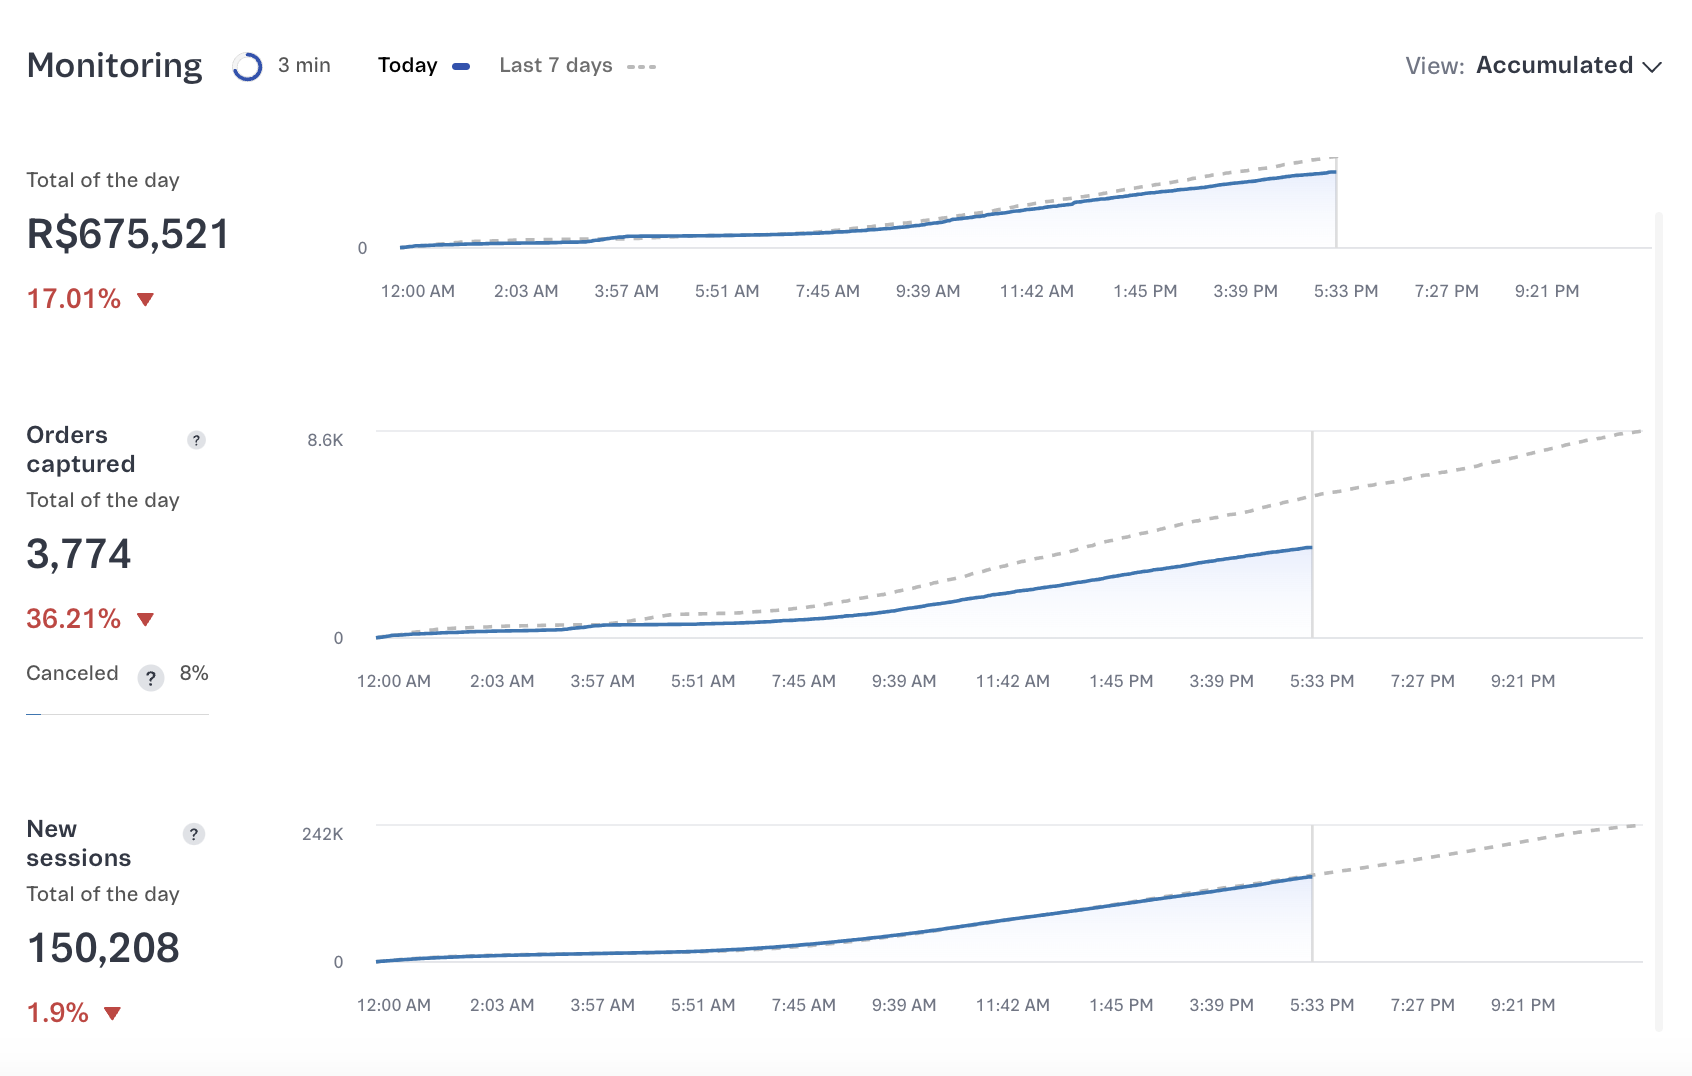
- Accumulated: Total value accumulated per day for each monitoring metric from 00:00 to the last update. The data in this view are updated every three minutes.
- Last 2 hours: Value received in the last two hours for each monitoring metric. This view doesn't show the comparison with other periods or the increase or decrease percentage of the metric. The data in this view are updated every minute.
You can also filter by store if you select one in the dropdown menu.
Monitoring
Each chart has the following elements:
- The X axis shows the time and the Y axis shows the value of the monitoring metric.
- Absolute value of each metric, which can be
AccumulatedorLatest hours. Learn more in Views. - The thicker blue line indicates the evolution of values today.
- The dotted gray line indicates the rate for the comparison period.
- When you hover over the chart, it will show the absolute value for each period being compared.
The table below describes the charts included in the Monitoring section of the page.
| Metric | Description |
|---|---|
| Revenue captured | Total amount determined by the final amount of captured orders, which shows the amount that the store received as revenue. Comparison between today and the selected period. |
| Orders captured | Number of orders received by your store today compared with the selected period. |
| Average ticket | Average revenue per order captured today compared with the selected period. |
| New sessions | Number of new visits or interactions in your store, depending on the selected View. This metric is only available for stores that collect browsing data. |
Metrics
The table below describes the metrics available on the home dashboard. All metrics are related to purchase flows in VTEX stores during the selected period.
| Metric | Description |
|---|---|
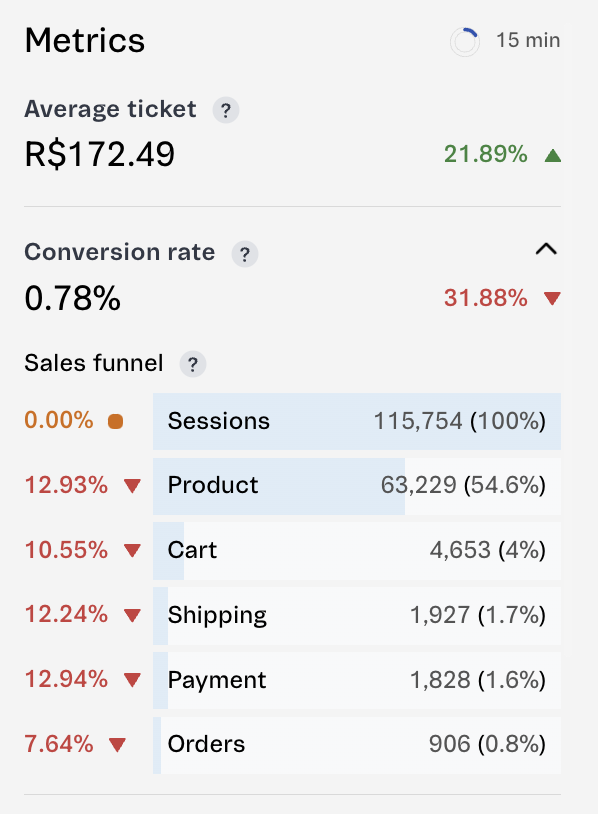
| Average ticket | Average amount paid for captured orders in the selected period. This metric is tracked as a down icon or an up icon to show the increase or decrease percentage of the average ticket. |
| Conversion rate | Percentage calculated by dividing the total number of orders by the total number of sessions in your store. When you click the arrow , the Sales funnel is expanded. |
| Highest grossing products | Products that generated the most revenue in the selected period. Shows the amount of revenue received and a percentage indicating the revenue increase or decrease, as well as a comparison between the selected periods. When you click the arrow icon , you switch between this metric and Best-selling products. |
| Best-selling products | Products that sold the most units in the selected period. Shows the number of items sold and a percentage indicating the increase or decrease of items sold, as well as a comparison between the selected periods. When you click the arrow icon , you switch between this metric and Highest grossing products. |
Sales funnel
In the Conversion rate metric, when you click the arrow icon , the Sales funnel will be expanded. This chart tracks and monitors session volume in the intermediate stages of the purchase flow and allows you to identify opportunities to optimize the conversion rate of your store. The table below describes the intermediate stages of the purchase flow.
| Stage | Description |
|---|---|
| Sessions | Total number of visits to your store |
| Product | The user accessed a product page during the session |
| Cart | The user added a product to the cart during the session |
| Shipping | The user completed the shipping information during the session |
| Payment | Payment information was completed during the session |
| Orders | Orders placed during the session |
Each blue bar in the chart represents the volume of sessions that have reached a certain stage of the purchase flow. This volume is represented as an absolute value and as a percentage of the number of sessions together with the increase or decrease percentage points in the sales funnel.